
PowerPoint offers a set of intuitive, built-in design tools that make it easier than ever to create professional-looking presentations without needing advanced design skills. One of the most powerful and underrated features is the Smart Shapes and associated formatting tools. In this blog, we’ll explore how to effectively use these tools to enhance the visual impact and functionality of your slides.
What Are Smart Shapes in PowerPoint?
Smart Shapes refer to the pre-defined geometric elements available in PowerPoint’s Shapes gallery, which include:
- Basic shapes (rectangles, circles)
- Arrows and connectors
- Flowchart elements
- Callouts and banners
- Stars, hearts, and other decorative shapes
These shapes are more than just graphics. They are dynamic, customizable objects that can hold text, link to other slides, and be modified to suit any purpose. These built-in tools are especially useful for beginners because they require no third-party design software. Whether you’re building a pitch deck, a marketing presentation, or a classroom lesson, Smart Shapes make it easy to visualize your thoughts in a structured, engaging way. Each shape adapts to your slide’s theme and layout, helping you maintain consistency without needing to format everything from scratch.
Where to Find Smart Shapes
- Go to the Insert tab.
- Click Shapes to see the full library.
- Click and drag on the slide to draw your selected shape.
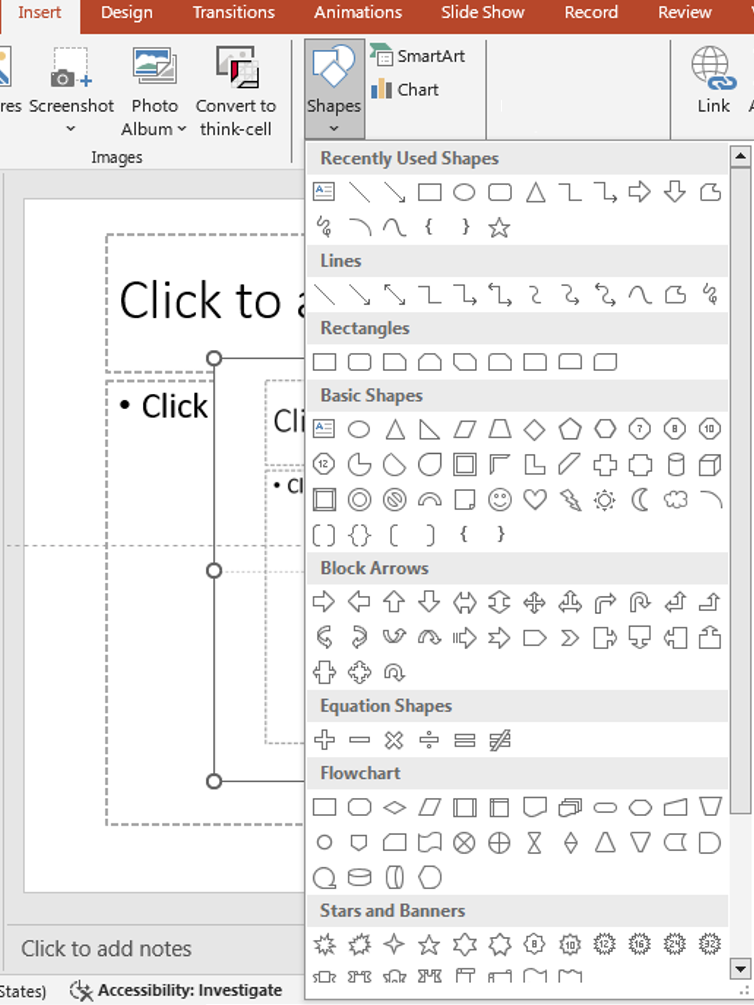
insert shapes
You’ll find the Shapes menu includes both commonly used elements and more complex visuals for advanced layouts. You can also access recently used shapes, making repetitive formatting much faster during large presentations. If you’re using a design theme, inserted shapes will automatically adopt the default style, which helps maintain a professional look without manual adjustments.
Top Design Tools to Use with Smart Shapes
- Shape Fill and Outline
- Change the interior color of a shape with Shape Fill.
- Modify the border color and weight with Shape Outline.
- Use Gradient Fill or Picture Fill for added creativity.
For corporate or branded presentations, you can apply your brand color palette directly to shapes. You can even use the Eyedropper tool to pick precise colors from your logo or background image, ensuring design consistency across your slides.
- Shape Effects
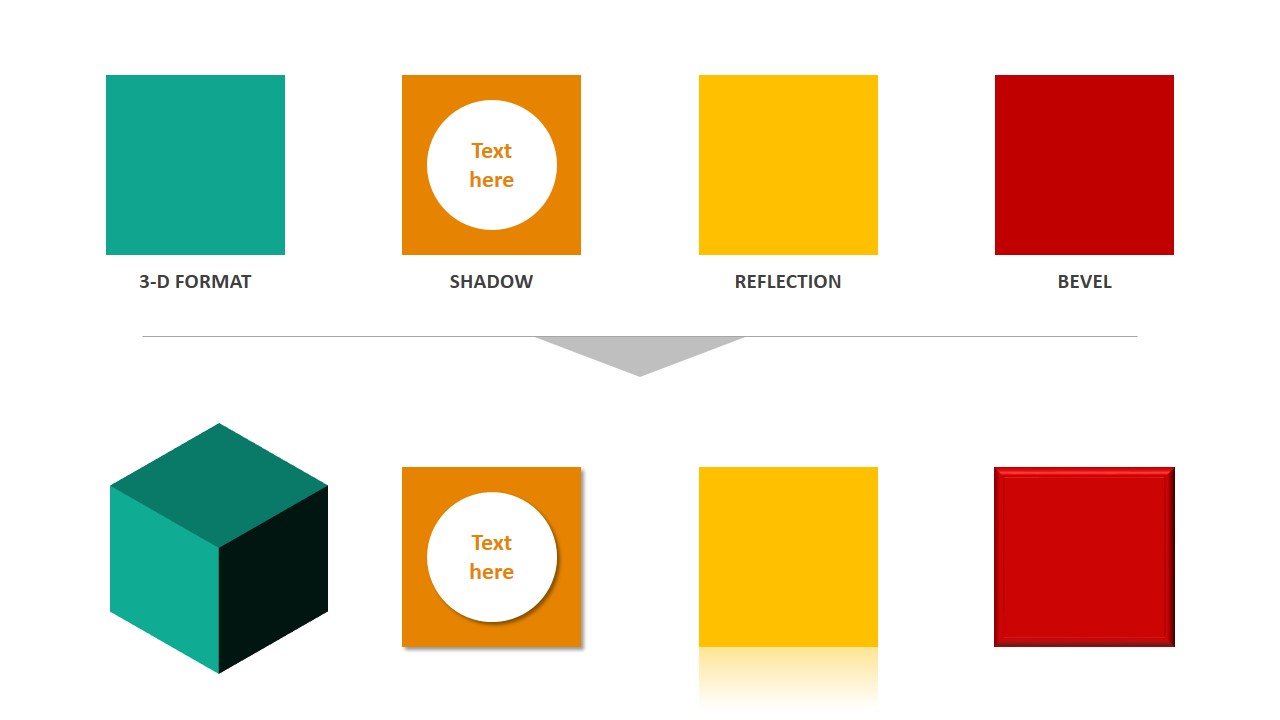
- Add depth with shadow, reflection, glow, or soft edges.
- Subtle effects can make your shapes stand out while remaining professional.
Keep in mind that excessive effects can distract from your content. A slight drop shadow or soft glow is often enough to elevate your visuals while keeping the slide clean and readable. Test on different screen sizes to ensure effects are not overpowering during presentations.
3. Edit Shape
- Right-click the shape and select Edit Points to customize its outline.
- This allows you to transform basic shapes into custom graphics.
Editing points is especially useful when you’re trying to match design elements to specific themes—such as turning a square into a stylized arrow or modifying a circle into a teardrop shape. This advanced control lets you create icons or unique visual motifs that are hard to achieve using just stock images.
- Align and Distribute
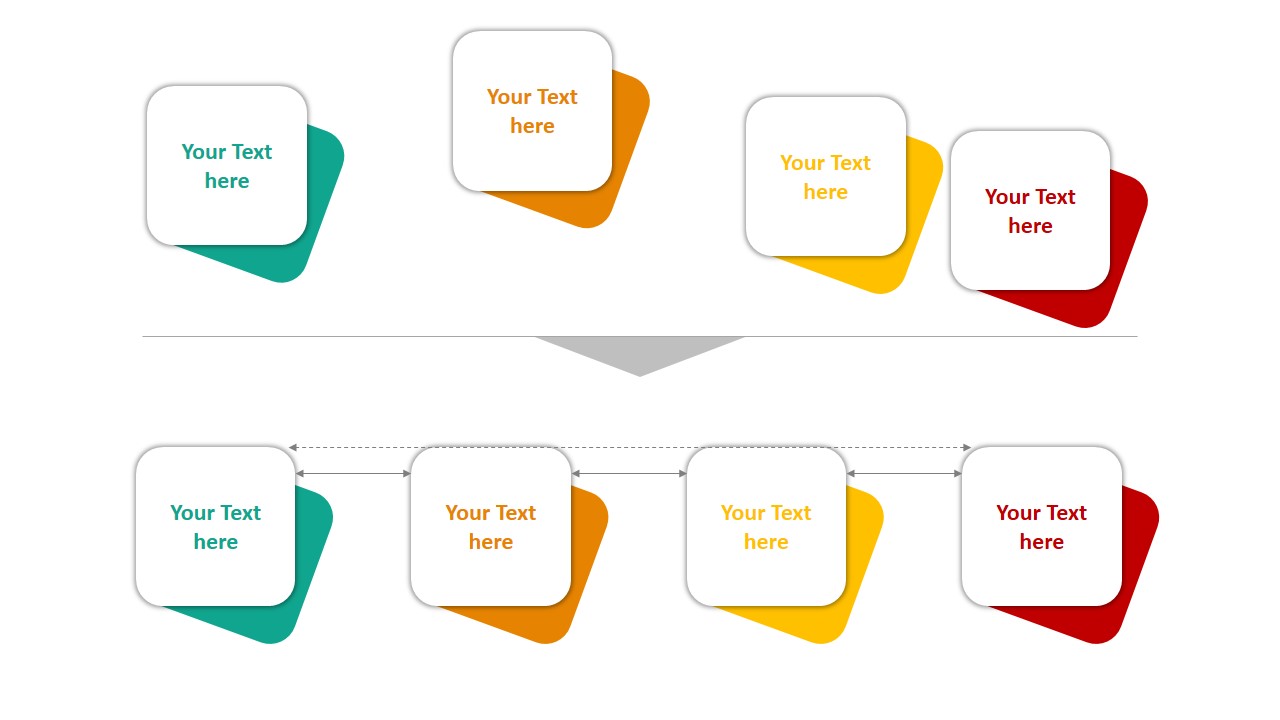
- Go to the Shape Format tab and use Align to position shapes precisely.
- Use Distribute to space shapes evenly across a slide.
Alignment is key to maintaining visual harmony. Use “Align to Slide” or “Align Selected Objects” based on your need. Distribute Horizontally and Distribute Vertically are crucial when building infographics or data-driven layouts with multiple elements. They help avoid uneven spacing, which can make slides appear amateurish.
- Add Text and Format It
- Click on a shape and start typing to add text directly.
- Customize font, size, alignment, and color using the Home tab.
Text inside shapes should be concise. Use bullets to break down information and improve readability. You can also use shapes as callouts or labels to annotate parts of charts or images, helping explain complex visuals in simple terms.
Creative Ways to Use Smart Shapes
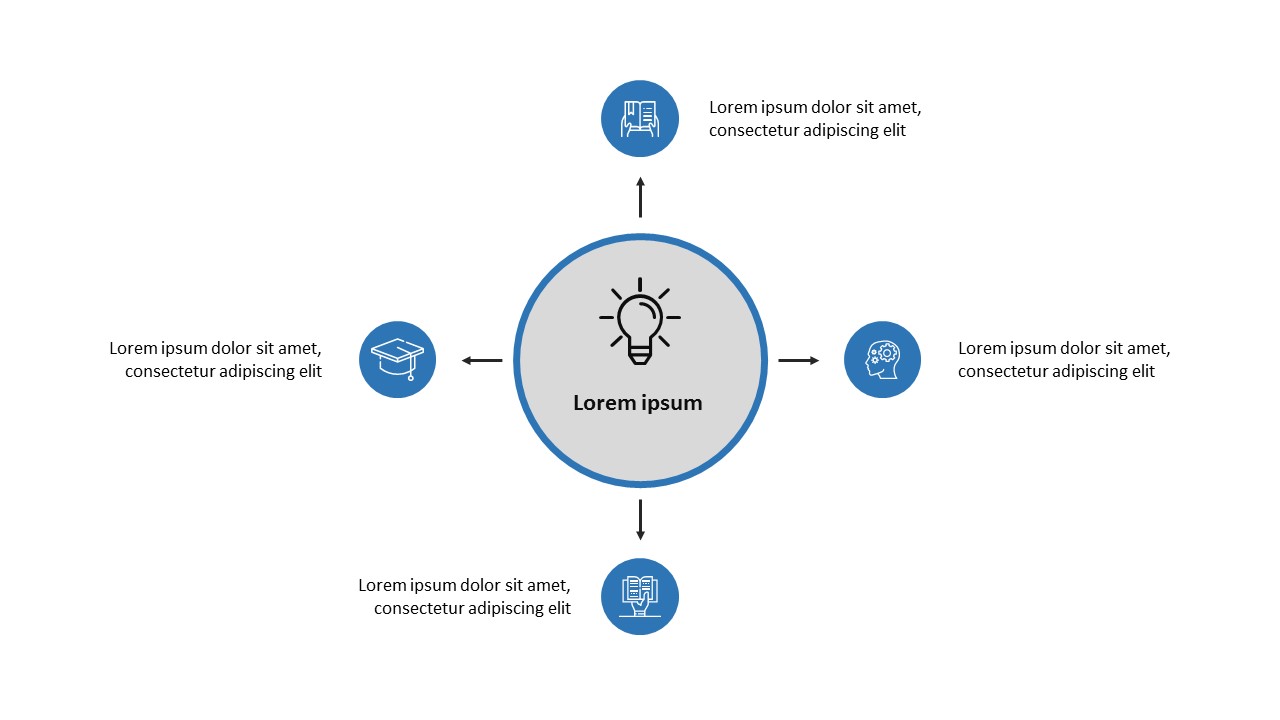
PowerPoint Diagrams
🔹 Data Highlights
Use arrows and banners to emphasize key statistics or trends.
📆 Timelines and Processes
Combine flowchart shapes and connectors to build visual timelines or workflows.
Use Smart Shapes like circles, hexagons, and arrows to visualize data and relationships.
📄 Custom Icons
Create your own simple icons by combining and formatting shapes.
Smart Shapes also allow layering. By sending shapes forward or backward, you can create depth and hierarchy. For instance, overlaying a semi-transparent rectangle over a photo can make text pop while maintaining the background image’s visual value.
Pro Tips for Better Results
- Keep it simple: Use a limited number of shapes and colors per slide.
- Be consistent: Use the same shape styles throughout your presentation.
- Use grouping: Group related shapes together for easy movement and alignment.
- Experiment: Try different shape combinations and effects to find what works best.
Before finalizing your presentation, test it in Slideshow mode to ensure all Smart Shapes appear correctly and animations work as expected. What looks aligned in the editor may shift slightly when projected, so a test run ensures pixel-perfect results.
Final Thoughts
PowerPoint’s Smart Shapes and design tools offer endless possibilities to enhance your visual storytelling. With just a few thoughtful design choices, you can transform your slides from basic to brilliant—all without leaving PowerPoint.
🌟 Start exploring Smart Shapes today and elevate your presentation game with powerful visuals and clean, effective design.